Vårgårda9 at 144.0 MHz
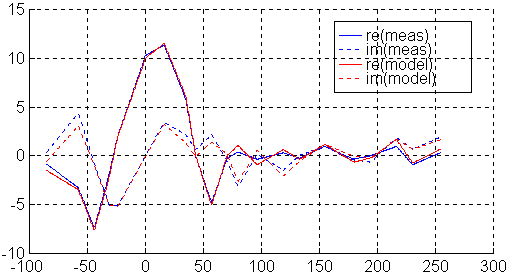
Fig 1. Vårgårda9 at 144.0 MHz.
The vertical scale is Voltage in arbitrary units. Horizontal is angle in degrees.
The signal is strongest at about 20 degrees elevation. The ground reflection from between the towers that arrives from -17 degrees is essentially in antiphase with the direct wave so for this small sized antenna the signal grows quite a lot with some elevation because a small reduction of the direct wave is compensated by a much larger reduction of the destructive reflected wave.
This figure shows that the amplitude and phase of the direct wave as well as the reflected wave are closely reproduced for all elevation angles. This means that the radiation pattern calculated by NEC2 is very close to the true pattern at 144.0 MHz.
Vårgårda9 at 148.0 MHz.
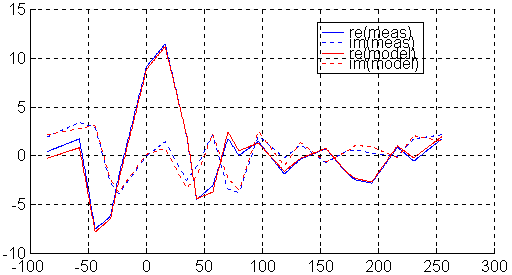
Fig 2. Vårgårda9 at 148.0 MHz.
The vertical scale is Voltage, same units as in fig 1. Horizontal is angle in degrees.
At this frequency the side and back lobes are much stronger compared to 144MHz, which measurements and model closely agree upon.
The back lobe of Vårgårda9.
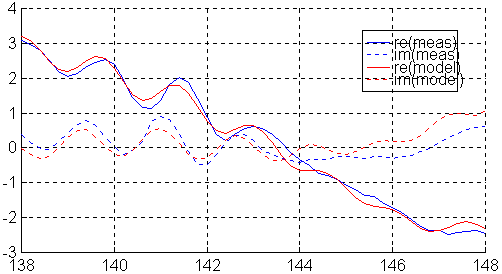
Fig 3. The back lobe of Vårgårda9.
The vertical scale is Voltage, same units as in fig 1. Horizontal is angle in degrees.
At an elevation angle of 180 degrees, the antenna points to the horizon in the same direction as the counter antenna. A house and several other objects are well illuminated by the counter antenna, and the main lobe of the AUT points directly towards them.
The measured data directly shows that there are at least two reflections at an average distance of about 94 meters (period 1.6MHz) and that the two main reflection points are separated by about 15 meters (they add at 140MHz and cancel at 145 so the period is 10MHz)
The computer model calculates the the amplitude and phase (phase is relative to the phase in the forward direction) for four waves illuminating the antenna. The sum of these four waves closely reproduce the experimental data.
Vårgårda9 magnitude of error at all frequencies and directions
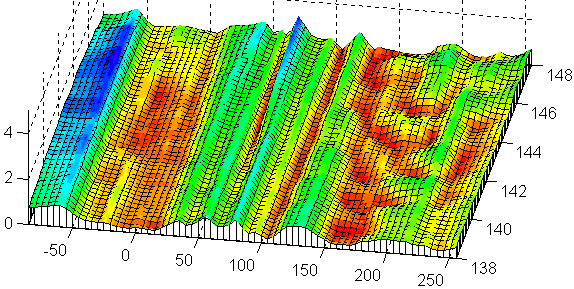
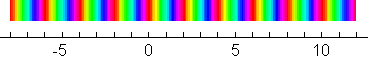
Fig 4. Vårgårda9 magnitude of error at all frequencies and directions.
The vertical scale is Voltage, same units as in fig 1. Horizontal are angle and frequency.
The magnitude of the direct wave is about 24 units but due to the strong reflected wave in antiphase the magnitude of the signal in the forward direction is about 12 units as can be seen in fig 1.
The side lobes between 45 and 135 degrees are about 3 times narrower than the main lobe, so they will see the direct wave and the reflected wave as two separete signals with magnitudes of about 24 and 14 respectively.
The maximum error is about 1.4 units or 6% of the forward signal and the average error is much smaller.
Vårgårda9 real part of far field at all frequencies and directions.

Fig 5. Vårgårda9 real part of far field at all frequencies and directions.
The vertical scale is Voltage, same units as in fig 1. Horizontal are angle and frequency.
The figure alternates between experiment and model. No particularly interesting difference can be seen.
Vårgårda9 imaginary part of far field at all frequencies and directions.
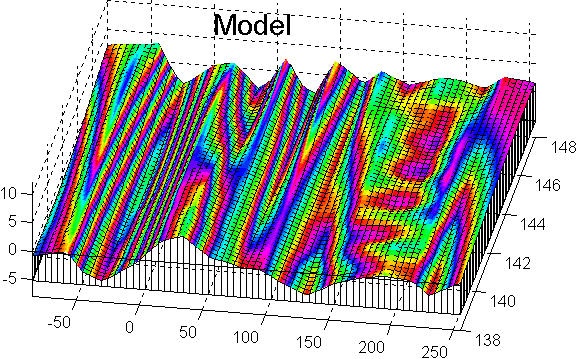
Fig 6. Vårgårda9 imaginary part of far field at all frequencies and directions.
The vertical scale is Voltage, same units as in fig 1. Horizontal are angle and frequency.
The figure alternates between experiment and model. No particularly interesting difference can be seen.
Cartesian plot of radiation pattern for vårgårda9.
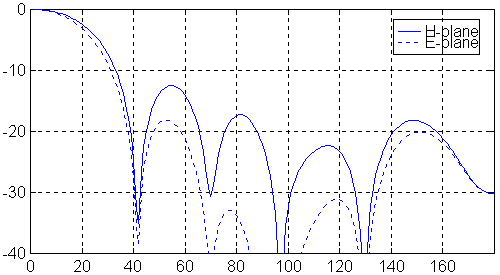
Fig 7. Cartesian plot of radiation pattern for vårgårda9 at 144.0 MHz.
The pattern is calculated by NEC2 using the "boom correction" that was found to be consistent with the experimental data during the parameter fitting process. The "boom correction" compensates for systematic errors within NEC2 as well as the influence from the boom tube.
Polar plot of E-plane pattern for vårgårda9.

Fig 8. Polar plot of E-plane pattern for vårgårda9.
Same data as in fig. 7.
This plot is more conventional, but less informative although
the gross characteristics are easier to see quickly.
Polar plot of H-plane pattern for vårgårda9.
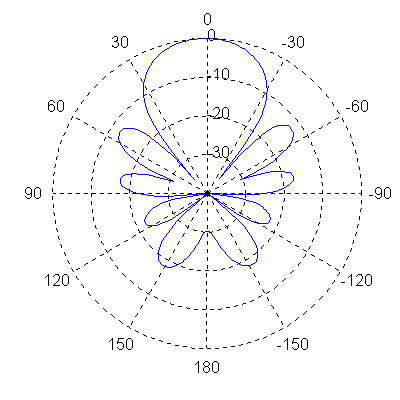
Fig 9. Polar plot of H-plane pattern for vårgårda9.
Same data as in fig. 7.
The polar H-plot is more informative than the E-plot.
Still the cartesian plot is a more efficient way of presenting the data.
Gain vs frequency for vårgårda9.
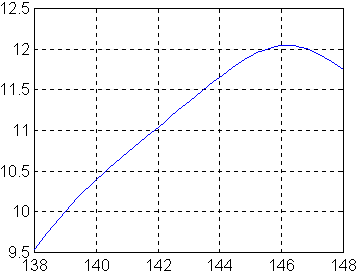
Fig 10. Gain vs frequency for vårgårda9.
This gain curve is calculated by integration of the corresponding radiation patterns. The gain values are with reference to the actual impedance of the antenna, not to 50 ohms.
The model fits very well to measured data for all frequencies so the errors in these gain figures are extremely small.