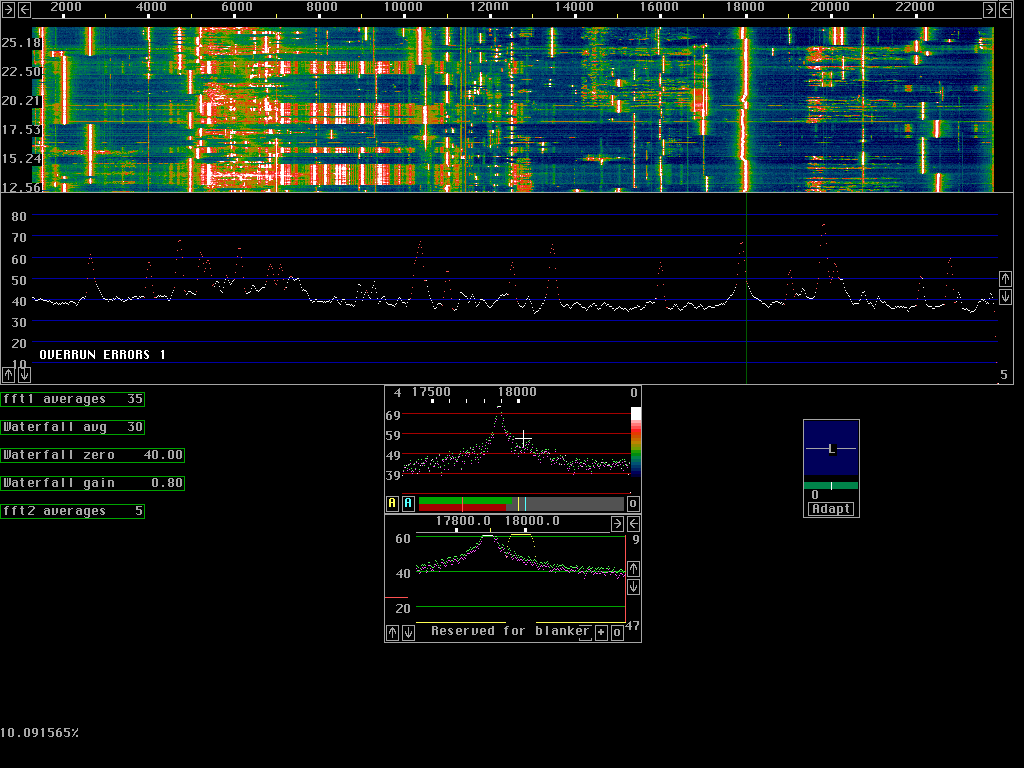
Leif SM5BSZ has produced a superb 'radio in software' that contains all of the functions necessary to operate in the style of the 21st century. Here is his description of it. If you don't want to go to the links as you scroll thru this webpage, don't worry. They are all relisted together at the bottom of the page click here to go to the links . This is a rather old page; I wrote it in February 2001. For some more recent comments on Linrad, click here. Next, because 1 picture = 1000 words, I've started with a screen grab of his receiver operating on the 20 meter cw band (this is an older version screen as you will see).
Across the top you see the frequency spread in Hz. I have it set up to cover 22KHz, which is a reasonable spread for 2 meter EME, where I plan to use it most. So I can see everything that is going on in a 22 KHz slice of the 2 meter EME band.
The small arrows at the top of the screen allow adjustment of the width of the spectrum in Hz, and of the center of the display, in Hz.
Below that is the waterfall display, showing signal intensity as a function of frequency horizontally, and as a function of time, vertically. Decimal minutes are displayed along the left vertical axis.
Below the waterfall is the realtime main spectrum display. Signal strength is the vertical axis, and frequency is the horizontal axis, corresponding to the same locations on the waterfall and the frequency calibration at the top of the graph. The little up/down arrows at the bottom left and middle right of this display allow you to adjust the centerpoint and range of the spectrum amplitudes displayed, so that the signals are the right vertical size for proper viewing, and centered as you wish on the display.
Below this on the left are the boxes to set the number of FFT1 averages per displayed point of the spectrum, the number of averages per line of the waterfall, the zeropoint of the waterfall, the gain of the waterfall, and the number of averages per displayed point of the high resolution spectrum.
To the right of this are two spectrum displays in smaller boxes. The upper box is the high resolution display. The lower box is the DSP filter / Noise Blanker display.
Here is the important and, really, incredible part. By clicking with the mouse cursor at any point on the main spectrum you cause that portion of the spectrum to be placed in the high resolution spectrum box and DSP processed. That is, that portion of the spectrum is DSP-filtered, noise-blanked, and converted to audio frequency so that it appears in your headphones or on your speakers. IT IS POINT AND CLICK RECEIVING!!! Because of the excellent DSP, this is an incredible experience. If you are not clicked on a signal, the receiver is silent. When you click on a peak, the signal pops into your headphones. To fine tune, you click on the peak in the high resolution spectrum, if need be, to touch up the tuning. If you want a different filter bandwidth, you just take the mouse down to the DSP filter / Noise Blanker display, and drag the filter curve wider or narrower, and the filter adjusts graphically. THIS REALLY WORKS!!
The yellow A and blue A at the bottom left of the high resolution window are for setting the 'dumb' and 'smart' digital noise blankers. You have your choice of none, automatic, or manual for setting these. The 'o' at the right bottom of this display turns on the oscilloscope function that shows the real and imaginary time domain spectra for the various channels of data.
There are several controls in the DSP filter / noise blanker window at the bottom of the screen. By dragging the yellow lines with the mouse you can set the filter width and shape factor. The red horizontal bar at the left of the window is the level or volume control. The vertical bar at the right of the window is the BFO control. You can vary the pitch of the received signal without taking it out of the filter passband or moving it in the display. Very nice. When you get down to W5UN's spectrum below you will see that I have adjusted the various windows to give a much nicer display, and that I have adjusted the BFO to give a lower pitch.
To the right of the high resolution display is the polarization control. The software receiver can be set up to receive two channels of data. In my case, one is the signal from the vertical elements of my M2 array, and the other is the signal from the horizontal elements. By rotating the line with the mouse you can select any desired receive polarization. In the future this will be able to be set to automatic, or 'adaptive' mode where the software constantly optimizes the polarization. Moving the line on the green horizontal bar changes the polarization from linear to elliptical to circular.
My setup here consists of a pair of simple dual conversion homebrew receiver modules (one for each polarization). I use 2 surplus computer controlled frequency synthesizers to drive the local oscillators (one for each LO, using a splitter to send LO signal from the synthesizer to each channel). The 2nd IF has its output at 15 KHz, and I feed this into an M Audio Delta 44 soundcard. This can sample at up to 96 KHz, so with my current 24 KHz bandwidth I am not stressing the system at all and have no aliasing. The signal is then processed in Leif's Linux Software Receiver and output to a SoundBlaster PCI64 to which my headphones are connected.
My computer is a Dell Dimension 8100 Pentium 4 running at 1.4 GHz with 256 M RAM. My videocard is a ($29) MagicVideo 3Ddx that uses a SiS 6326 chip. I chose this because its pretty plain vanilla and Linux supports it. My original card was an ATI 32 MB Radeon AGP, and it was not supported and the Beta drivers would not work for me. I am using a PS2 trackball and USB keyboard. Click here to go to the page where I give some more details of how I set up my Linux computer to run Leif's program. Click here to go to a page where I show how I set the FFT parameters within the dsp program. These work on my computer (P4 1.4 GHz) but would be far too calculation intensive for a slow machine. How fast a machine do you need? I don't know, but the dsp program indicates that my machine is idling 92.4% of the time. In otherwords, only 7.6% of its processing power is being used by the program. Leif has a very nice page that discusses timing / computation intensity issues and gives some examples for various hardware combinations. It is at:
www.nitehawk.com/sm5bsz/linuxdsp/fft1time/fft1time.htm
If you don't have a receiver with a wide (e.g.24 KHz) IF bandwidth you can still experience the wonder of Leif's receiver. On his website he has a 2 minute slice of EME contest input (10 MB file) that you can download. Once you have his receiver running on your computer you can put the 'adfile' that directs dsp to this data file in the dsp (receiver) directory and when you enter the program you can type 'h' and the program will run just as if you were actually receiving this data. You can click on the various signals, and even play with the receive polarization control. It is truly amazing to do this! Or, you can leave both the adfile and the raw data file in the 'eme' directory created when you use bunzip2 and tar to expand the files. On my machine this works better if I run things in the dsp directory with the parameters I set up than when I run it in the eme directory with the parameters that come with the raw EME file, but you may find otherwise on your computer.
The URL for Leif's main DSP radio for Linux on Intel platforms page is http://www.nitehawk.com/sm5bsz/linuxdsp/linroot.htm . There are many useful pages and diagrams, screenshots, etc that are accessed from this page. It is a real treasure trove. He has a page with tips on how to get started with LinRad (the new name of this software) at http://www.nitehawk.com/sm5bsz/linuxdsp/linrad.htm .
The URL for his main homepage is http://www.nitehawk.com/sm5bsz/ . I've made a small FAQ page here . If you don't see the questions you want answered, ask me them and I'll include them along with answers if I can.
I am still setting all of this up, and have optimized neither my software settings or my homebrew receiver hardware, but it was still a real thrill to copy my first two signals off the moon with the software receiver. They were of course W5UN and KB8RQ, and both were solid Q5 copy. Below are screen dumps of each, with just a little bit of text.
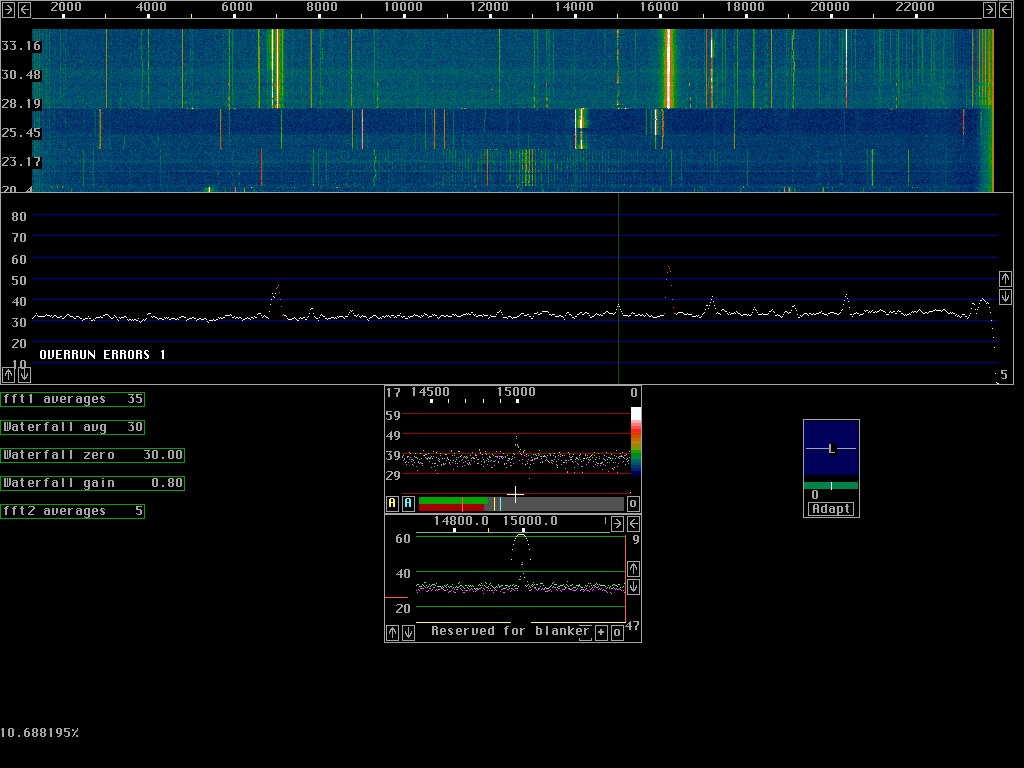
You can see Gary KB8RQ's waterfall trace at 15000 Hz, among the many external noises I have in this urban environment. It appears as a dashed line as he alternately transmits and listens. Below the waterfall you can see the cursor on his signal on the main display. Below that on the high resolution display you can see his signal again. And finally, on the DSP filter /noise blanker display you can see his signal centered (roughly) within the filter passband. You can see that I have the filter bandwidth set to about 50 Hz. This works very well here, and is where I generally leave it.
Here is a screen dump of a spectrum with Dave, W5UN's signal:
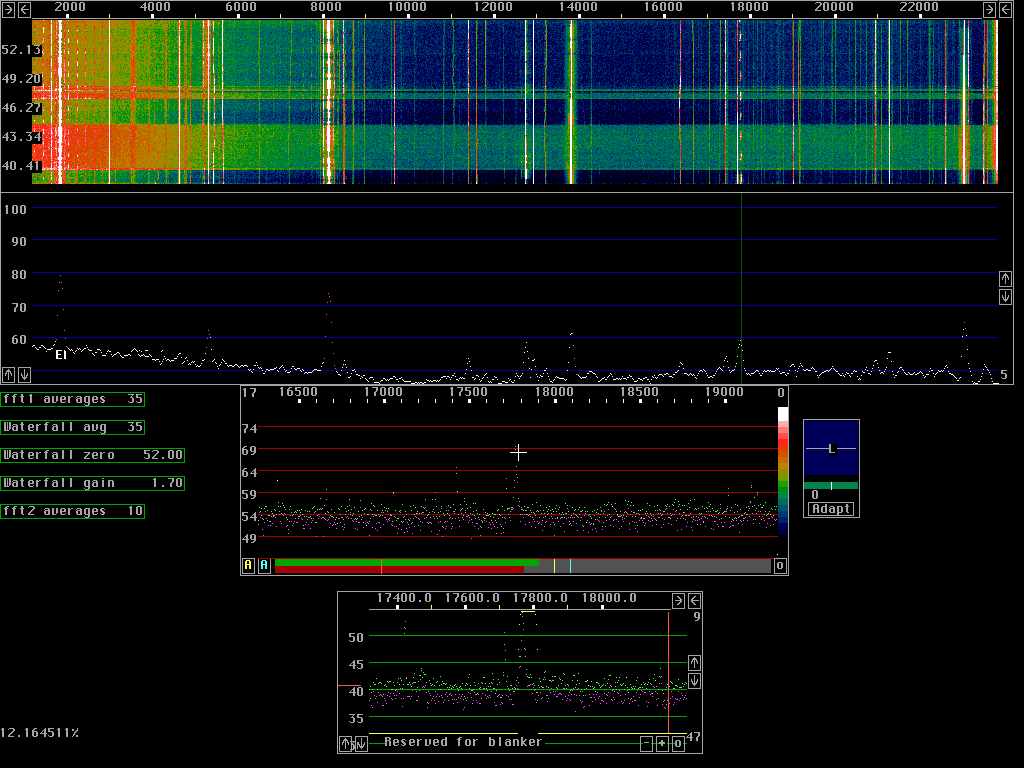
On the waterfall display you can see Dave's signal appearing as a dotted line (because he is alternately transmitting CQ and listening) just to the right of an external signal near 18000 Hz. On the waterfall display the external 'birdie' is just a hair's width below Dave's signal. Note that the color of the background on the waterfall varies from almost black to green or yellow with time (vertical axis). This is due to the received baseline noise level changing. I have found that using the display is a very good way of analyzing the patterns of change in the noise floor, the first step in determining the source of such disturbances. Below the waterfall display, in the main spectrum display, you can see the green vertical cursor on Dave's signal that serves to select it for processing for the high resolution spectrum display, DSP-filtering, noise blanking, and output for audio copy by the operator. The 'birdie' and Dave's signal run together on this display. On the high resolution display there is excellent resolution of the signals; Dave's is to the right of the birdie and the mouse cursor '+' sits nearly exactly over Dave's signal. The DSP filter display below the high resolution display shows that the filter, set to about 50 Hz, is not quite centered on Dave's signal (which is at the lower end of the filter window). Dave's signal is WELL separated from the birdie that is about 40 Hz lower in frequency. There is NO problem separating them on this receiver. The red bar just above the 40 mark on the left of the screen is the level or volume control. The vertical red bar on the left of the DSP filter / noise blanker display shows the BFO frequency. I have brought it in to reduce the pitch of the received signal. Note: all of the 'birdies' (and there are many) are external signals here, that I receive with each of my receivers (this one, an Elecraft K2/SSB Electronics LT2S MkII combination, an ICOM 735/SSB Electronics LT2SMkII combination, and an ICOM 970. They are present only with the antenna connected, and come and go with time and with variation of the antenna heading and polarity.
Below is a spectrum of a very noisy day on 144 MHz. Just below 16000 Hz on the waterfall and main spectral displays is the W3CCX beacon. Note that the waterfall has a red background, and that on the spectral display the beacon is barely above the noise. Usually it is 30 dB or more above the noise, but the high pulse noise level is causing these changes. If you compare the noise baseline to the screen dumps above, you will see that it is about 20 dB higher on the screen below. This is the noise. No other changes in receive parameters were made, so the difference IS the noise floor difference between the two listening period. The processing that takes place in Leif's program removes the noise and returns a fully copyable signal, where it did not exist before.
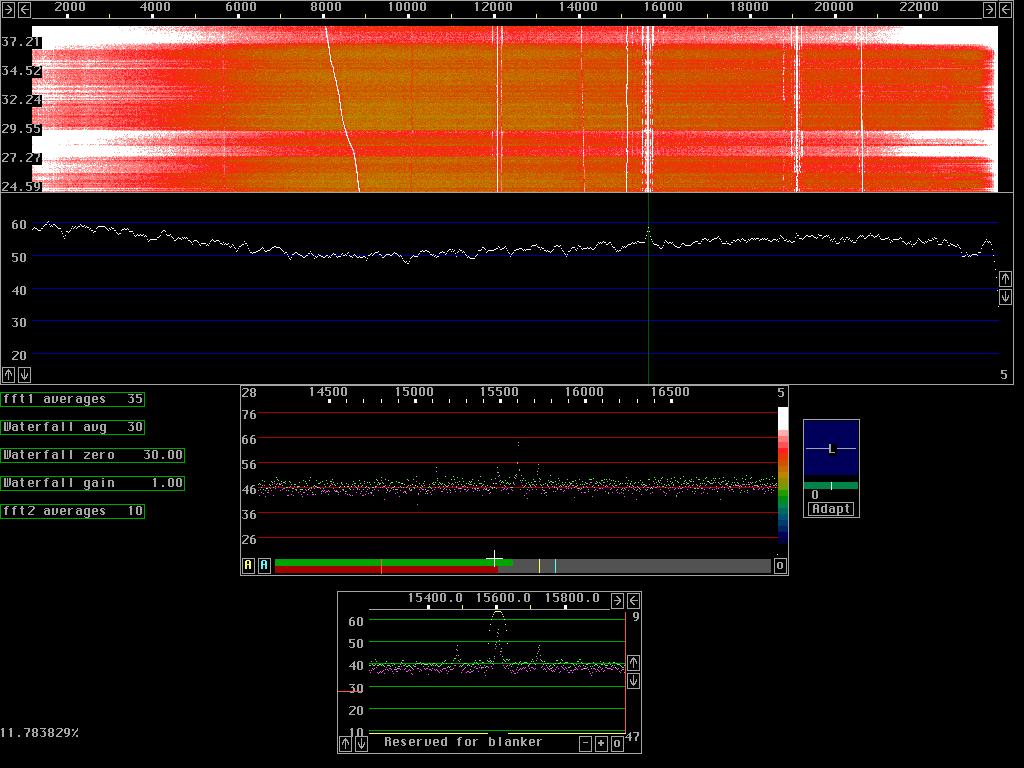
Here is a screen of the W3CCX beacon on two meters with the FFT parameters set more optimally. I've changed the positions and size of the two lower display panels. Note the frequency resolution on the high resolution and the dsp filter / noise blanker windows (frequency scales at the top of each window). Note the filter width is about 20 Hz, and I have brought it in to just include the keying sidebands. This makes for an awesome receiver!!
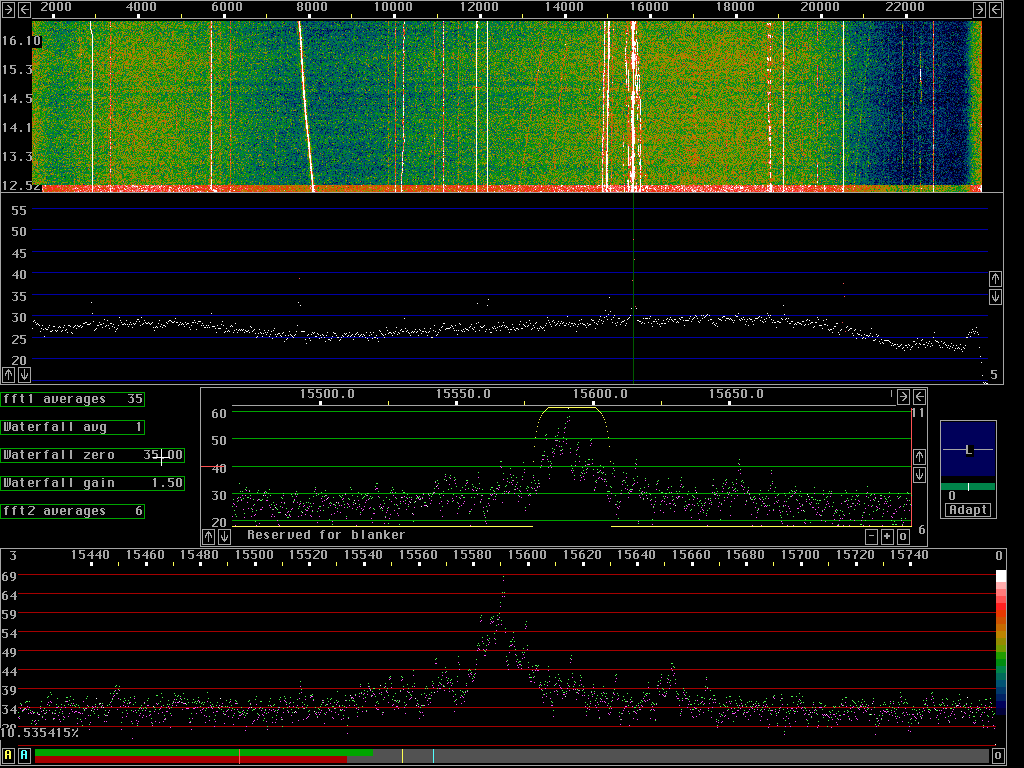
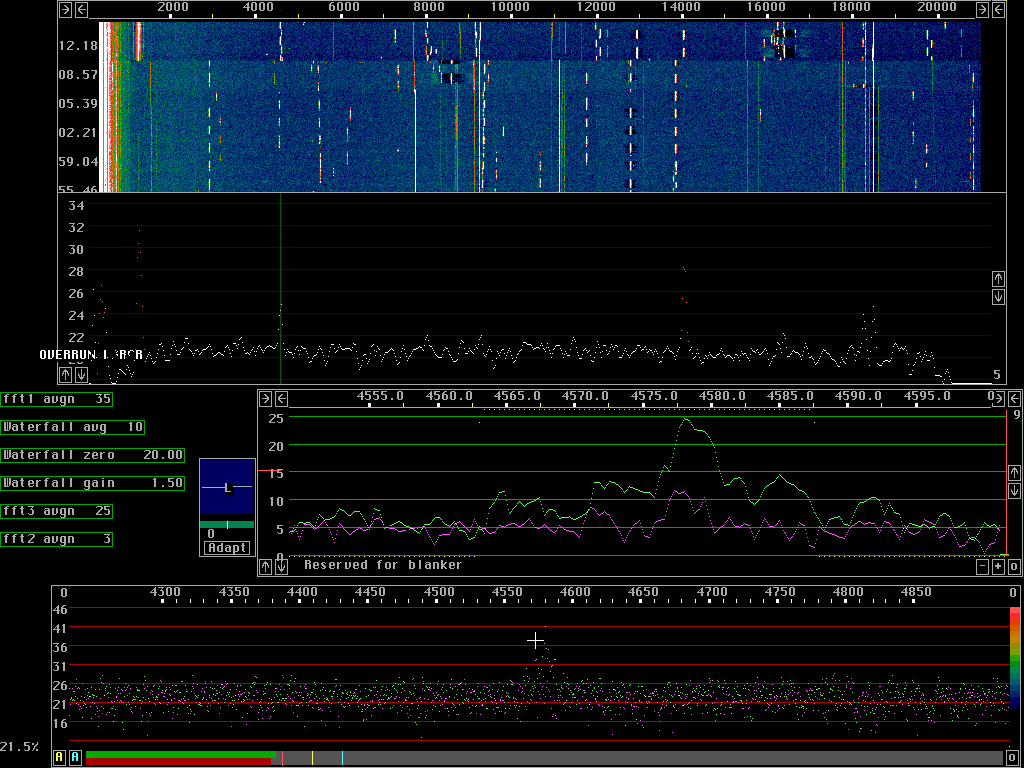
Finally, here is a screenshot I made of a 20 KHz portion of the 144 MHZ band during the 1999 EME contest. In June of this year (2001) Leif SM5BSZ sent me a CD with one hour's worth of the contest on it. I played it back and fed it into the Delta44 soundcard and ran Leif's DSP program. On the waterfall display at the top of the screen you can see many EME stations; of course they look like dashed lines running vertically from top to bottom of the waterfall. I was able to listen to the contest and pick out dozens of EME stations using Leif's program. I heard many more than I did operating at home at W3SZ in 1999! The cursor is on a station at 4575 Hz, near the bottom of the band segment, that is only 4-5 dB above the noise, but Q5 copy. Note that in the middle spectrum (the baseband spectrum) the frequency scale is very expanded. I am using a 25 Hz filter that is roughly matched to cover the width of the keying sidebands of the station, that are easily visible.
Well that's all there is...hope you enjoyed it! Now get out there and get going with Leif's Linux-based PC receiver!! Let me know if I can help.
Leif's Linux Receiver Getting Started Page
Leif's page discussing time/hardware issues
How I set up Linux and the program here
How I set the parameters within the dsp program here