ARRL Frequency Measuring Test (FMT) 2002 at W3SZ
My main interests in Amateur Radio are VHF and UHF and Microwave weak signal work, including also 144 MHZ EME. This has led me to try to achieve a high level of frequency accuracy for my station. I have achieved this by locking the system to very stable 10 MHz oscillators. I have available for use both Rb-controlled and GPS-controlled oscillators. For the ARRL FMT I used a Hewlett-Packard Z3801A GPS Receiver and Stabilized 10 MHz oscillator as my frequency standard. The Z3801A frequency locked my local oscillator, a PTS (Programmed Test Sources, Inc.) frequency synthesizer that I obtained surplus. The PTS synthesizer was controlled by a simple Basic program that allowed me to jump from one ARRL FMT band to another with the stroke of a key. I used a separate Efratom FRS 10 MHz standard to control a second PTS frequency synthesizer that I used as an independent signal source, to check the stability and precision of my ARRL FMT setup.
My equipment chain is shown in the block diagram. I used a Cushcraft R7 vertical antenna to feed a receiver I built from a kit produced by Expanded Spectrum Systems (http://www.expandedspectrumsystems.com) which is operated by Rich Kennedy N4ESS and Bill Coleman N4ES. The output from the receiver (named The Time Machine) was fed to an M-Audio Delta44 soundcard, and then into a Pentium 4 computer running at 1.4 GHz. The operating system was RedHat Linux 7.2 and the computer was running the software radio Linrad developed by Leif Asbrink, SM5BSZ (http://www.nitehawk.com/sm5bsz/linuxdsp/linrad.htm).

The Time Machine is a Direct Conversion receiver which covers the Amateur Bands in the range of 3.5 to 30 MHz. It takes an RF signal from the antenna and converts it to baseband, basically an audio-range signal between 0 Hz and the sampling rate of the soundcard. Because The Time Machine uses a Quadrature (I/Q) mixer its receive bandwidth can be as high as the sampling rate of the soundcard. The Delta44 samples at up to 96000 Hz, and so up to 96 KHz of spectrum can be viewed at a time. For this application we limited the sampling rate and bandwidth to 48 KHz, so a standard Soundblaster type soundcard would have worked fine. Once the soundcard sends the baseband signal to the computer, Linrad processes the signal using DSP techniques and produces audio and visual output. Linrad is very flexible and powerful: see Leifs web pages at the URL given above, or go to my Linrad webpage for more details.
For the ARRL FMT I set LInrad up to just receive a narrow band of frequencies centered around the frequencies of interest (3580 KHz, 7047 KHz, and 10000 KHz). I set the PTS local oscillator so that in each case the frequency of interest would read out at 20,000 on the Linrad spectral and waterfall displays. Linrad has a very accurate Automatic Frequency Control (AFC) algorithm, and displays the received frequency vs time when this is activated. So I activated the AFC and arranged the Linrad display so that the AFC display occupied most of the receiver screen. Then I could just read off a graph the received frequency vs time, and average the values received to come up with the received frequency of W1AW during the ARRL FMT.
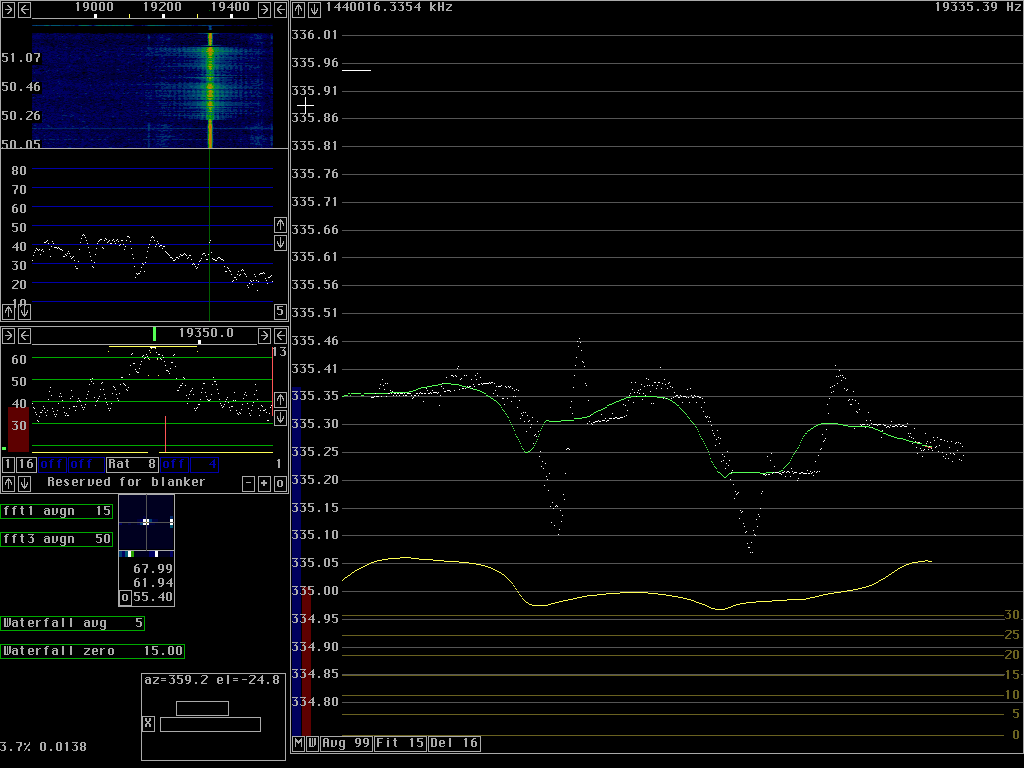
Leifs program allows total flexibility in setting up the Linrad display, by just clicking and dragging the display boxes. A typical screen set up just for the ARRL FMT is shown in the file 80a1123.png. At the upper left is the waterfall display, and you can see the W1AW signal between 19300 and 19400 Hz. Below that is the main spectral display and beneath the cursor in that display is the W1AW signal. Beneath that display is the baseband display and filter window.
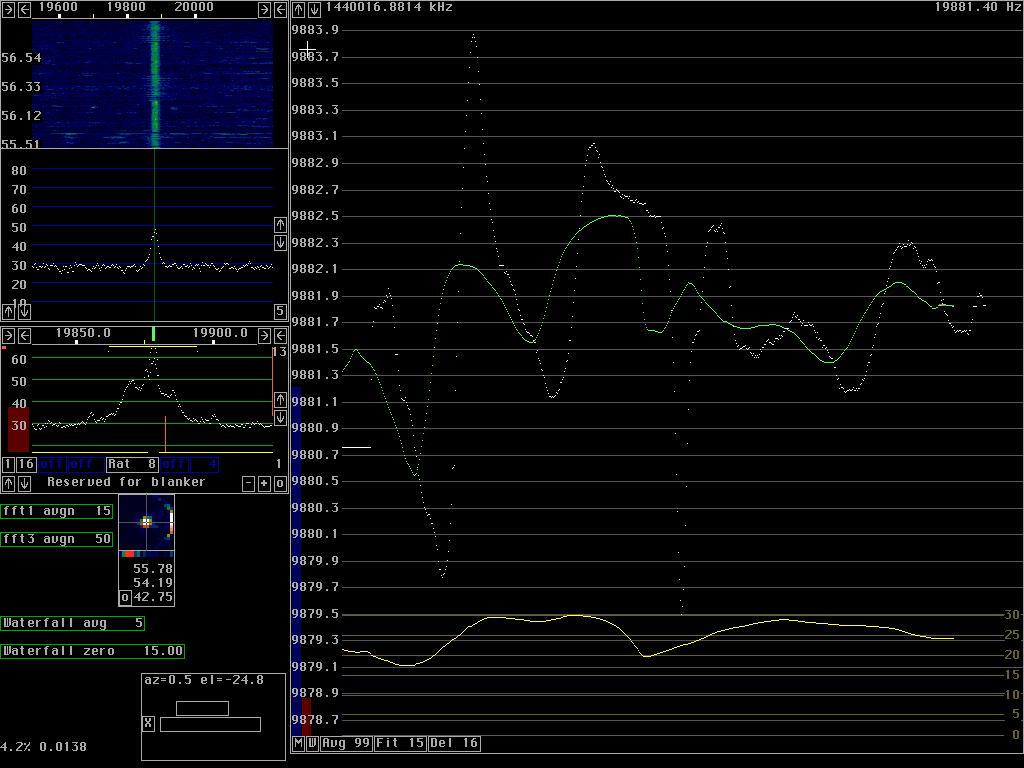
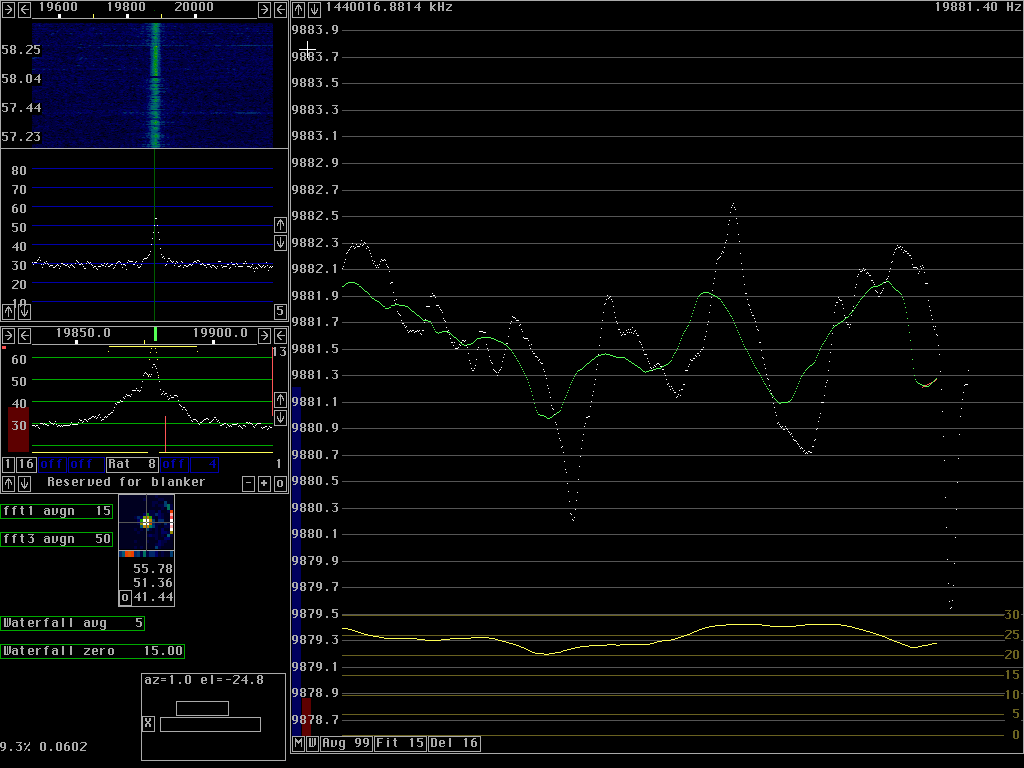
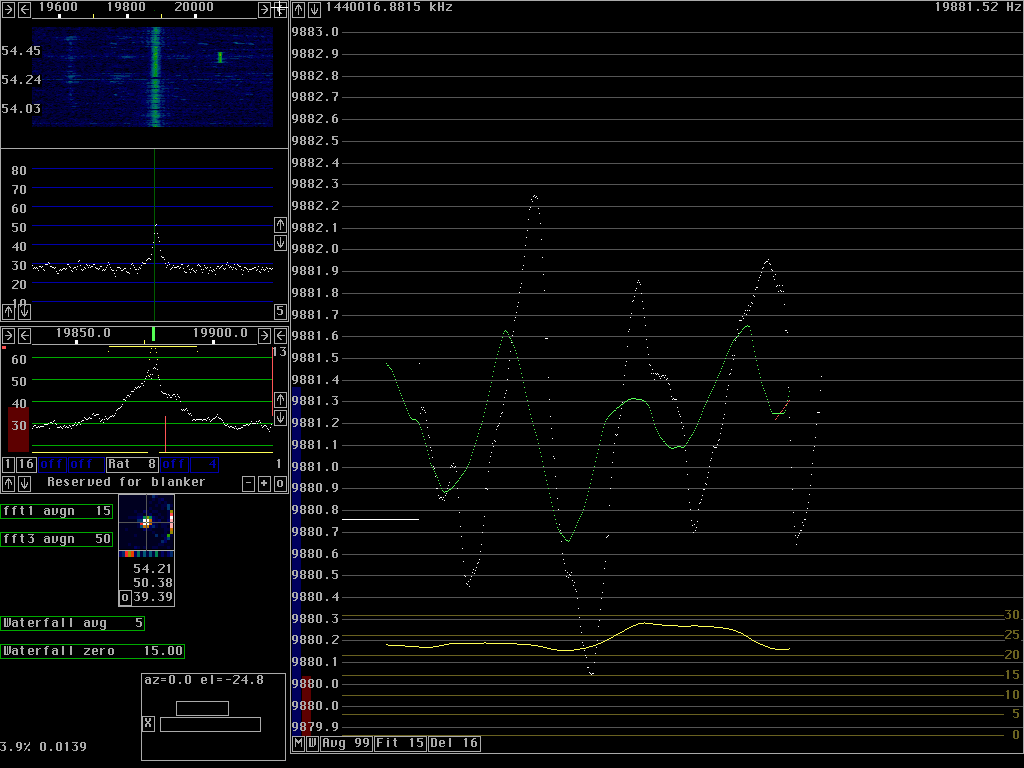
To operate Linrad for the ARRL FMT I just clicked on the W1AW signal seen on the waterfall display. This activated the AFC algorithm, and a plot of receive frequency vs time was generated in the large display window on the right of the screen. On the AFC display the vertical axis is labeled in Hz and fractions of a Hz. Each white dot represents the oscillator frequency used by the program to convert the signal to baseband. The green line is the plot of the received frequency vs time, with the results of 99 transforms averaged for each value shown. The yellow line shows signal to noise ratio of the received signal vs time.
Linrad allows one to store the raw received signal as it is received in real-time for processing. When this is done the ARRL FMT or any other received event can be replayed and reanalyzed at will at any time or times in the future. I have made great use of this feature with events such as the Leonids meteor shower, and EME contests, in each case recording a 90 KHz wide swath of spectrum. This provides an opportunity to both work the event or contest, and then later review the event in its entirety, watching other frequencies than the one I operated on, and seeing how other operators functioned during the event, and what opportunities I might have missed or better exploited.
My test procedure for the FMT was:
Use The Time Machine and Linrad to receive and record 10 MHz WWV signal for reference.
Use The Time Machine and Linrad to receive and record 80 meter ARRL FMT signal for later processing.
Use The Time Machine and Linrad to receive and record 40 meter ARRL FMT signal for later processing.
Repeat 2 and 3 until test ends.
Again use The Time Machine and Linrad to receive and record 10 MHz WWV signal for reference.
Use The Time Machine and Linrad to receive and record 10.010 MHz signal from separate Rubidium-oscillator-controlled PTS 40 synthesizer to check frequency offset and stability of system.
Play back data and generate and print screens of data for analysis.
Determine systematic error, if any, of system by reviewing WWV and Rb oscillator data.
Graphically average the W1AW frequency data.
Correct the averaged data for systematic errors.
Report results.
My Results were calculated as follows:
80 Meters ARRL FMT Result
I recorded 4 sets of data, 80a, 80b, 80c, 80d. Only 80a and 80b were done before W1AW announced that the test was going to 40 meters. Therefore only these two files were used for the calculations. This is important because W1AW showed a 0.4 Hz downward drift during the total duration of the test on all bands. I am confident that this drift was peculiar to W1AW, as neither WWV nor my independent Rb standard showed this drift. By using only the earlier times for my 80 meters analysis, my estimated frequency is higher than if all time periods had been used.
The following files were graphically averaged and the frequencies determined as shown
80a1123.png 19335.36 Hz
80b1123.png 19335.31 Hz
Average of these two frequencies: 19335.335 Hz , rounded to 19335.34 Hz.
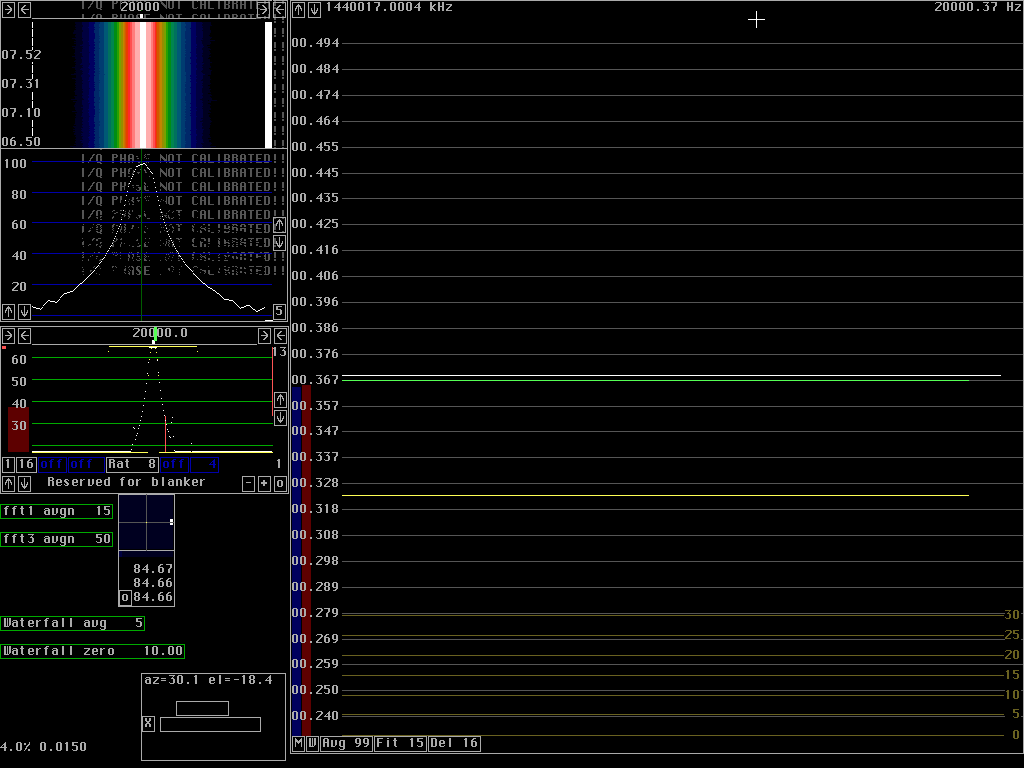
The Rb data (rb10mhz.png) showed a systematic error of the system of +0.37 Hz.
The WWV data (wwv1123a, wwv1123b, wwv1123c) showed a systematic error of 0.34 Hz. I chose to use the WWV data because, while less precise (there was NO variation in the Rb data-see the png file), I could not exclude a systematic offset error with the Rb data. In any event, the Rb data and the WWV data agreed to within 0.03 Hz, which I felt was close enough.
So the 80 meter offset from the expected frequency of 3580 KHz was:
19335.34 (0.34 Hz correction for systematic error) 20000.000 Hz = -665 Hz
Thus the actual 80 meter frequency was 3580 0.665 = 3579.335 KHz, or 3,579,335.00 Hz.
40 meters ARRL FMT Result
I recorded 3 sets of data, 40a, 40b, and 40c. Only 40b was done during the interval that W1AW announced that the test was being done on 40 meters. Therefore only data from this file was used for the calculations.
The following files were graphically averaged and the frequencies determined as shown
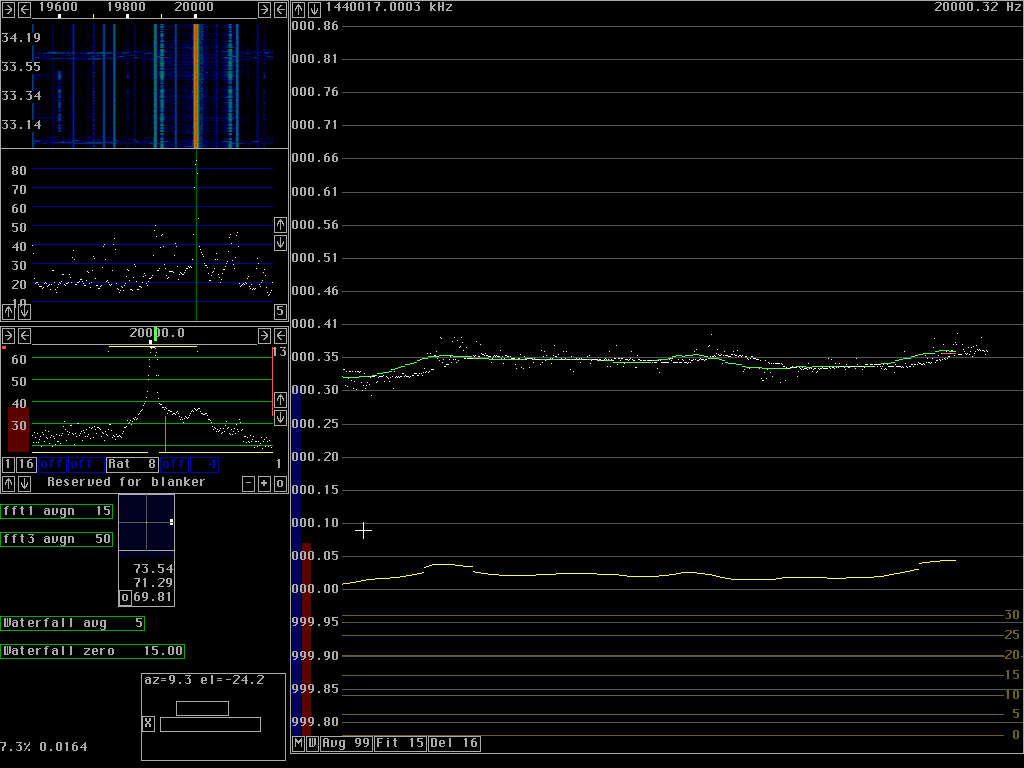
40b1123a.png 19881.80 Hz
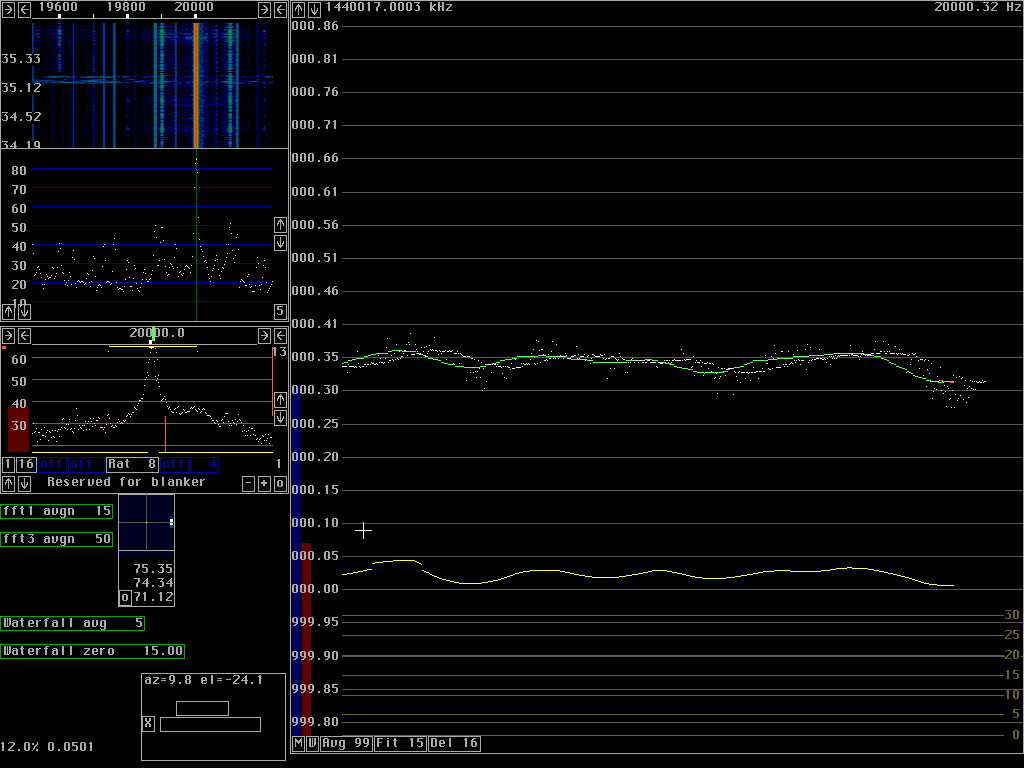
40b1123b.png 19881.60 Hz
Average of these two frequencies: 19881.70 Hz.
Again the WWV data was used to correct for the systematic offset.
So the 40 meter offset from the expected frequency of 7047 KHz was:
19881.70 Hz (0.34 Hz correction for systematic error) 20000.000 Hz = -118.64 Hz.
Thus the actual 40 meter frequency was 7047 0.118.64 = 7046.8814 KHz, or 7,046,881.4 Hz.
Summary
How did I do in the 2002 ARRL FMT? Well I got an official letter dated December 30, 2002 from Joseph Carcia, NJ1Q at W1AW who noted:
I measured: W1AW reported Frequency Error (Hz) Error (ppm)*
3579335.0 Hz 3579335.2 Hz 0.2 0.06
7046881.4 Hz 7046882.3 Hz 0.9 0.13
* Due to Doppler effects and other propagation anomalies, errors of less than about 0.4 ppm are considered normal, or within the expected range due to natural propagation phenomena and not instrumental errors.
If you look at the png files I provided, you will see that in fact the propagational variations in the received signal on 40 meters were tremendously larger than those on 80 meters. On 40 meters there is more than 1 Hz propagational variation in a relatively short period of time. But in any event, BOTH of my measurements were clearly limited by propagational effects. That is, the instrumental error in my frequency measurements was not significantly different from zero. So I did OK for a first attempt.
The limitations of my data are
1. Propagation-induced frequency variation (the largest source of potential error).
2. W1AW had a gradual 0.4 Hz downward drift (measured on 80 meters). I am not sure why this was so. Neither WWV nor my independent Rb source (not used to stabilize my frequency for this test, but only used to check system performance) showed this drift.
3. Given the drift, knowing when to measure the signals was important. To my surprise although the published information indicated that the frequencies would be run simultaneously, during the test the CW indicated a progression of bands was to be followed during the FMT. This seemed to indicate that W1AW would calibrate its frequency for each band during the designated period, so I only used the designated periods to generate my data, and not the entire run on each band.
4. The simple method of graphical rather than numerical analysis I used (the laziness factor).
For next year I can improve things when I again try the ARRL FMT by:
- Having a better knowledge of what exact times W1AW will use in computing their average frequency on each band
- Using numerical analysis instead of simple graphical averaging
- Using a more sophisticated antenna system to reduce the effects of propagation on the received signal.
I hope this was of some interest.
Click here to go to my page discussing The Time Machine, by ESS.
The png files I placed on this website that are relevant to the above text are:
Rb10mhz.png Linrad screen receiving a separate PTS synthesizer set to 10.010 MHz, NOT locked to the Z3801A, but locked to a separate Rb 10 MHz oscillator. This is used to test stability and accuracy of the frequency measurement system. Note the systematic offset of 0.37 Hz. Note the stability of the system. This frequency does not vary within the limit of measurement (less than 0.01 Hz) over a period of hours.
wwv1123a.png , wwv1123b.png , ww1123c.png Linrad screen receiving WWV at 10 MHz, used to correct for any systematic error of the frequency measurement system prior to calculating final results
80a1123.png , 80b1123.png Linrad screens receiving W1AW on 80 meters during the ARRL FMT that were used for the calculation of the W1AW frequency.
40a1123.png This is a Linrad screen receiving W1AW on 40 meters during the ARRL FMT. Not used in the analysis as this was obtained during the 80 meters portion of the test according to the CW announcement.
40b1123a.png, 40b1123b.png Linrad screens receiving W1AW on 40 meters during the ARRL FMT that were used for the calculation of the W1AW frequency.
Copyright 1997-2007 COPYRIGHT Roger Rehr W3SZ. All Rights Reserved